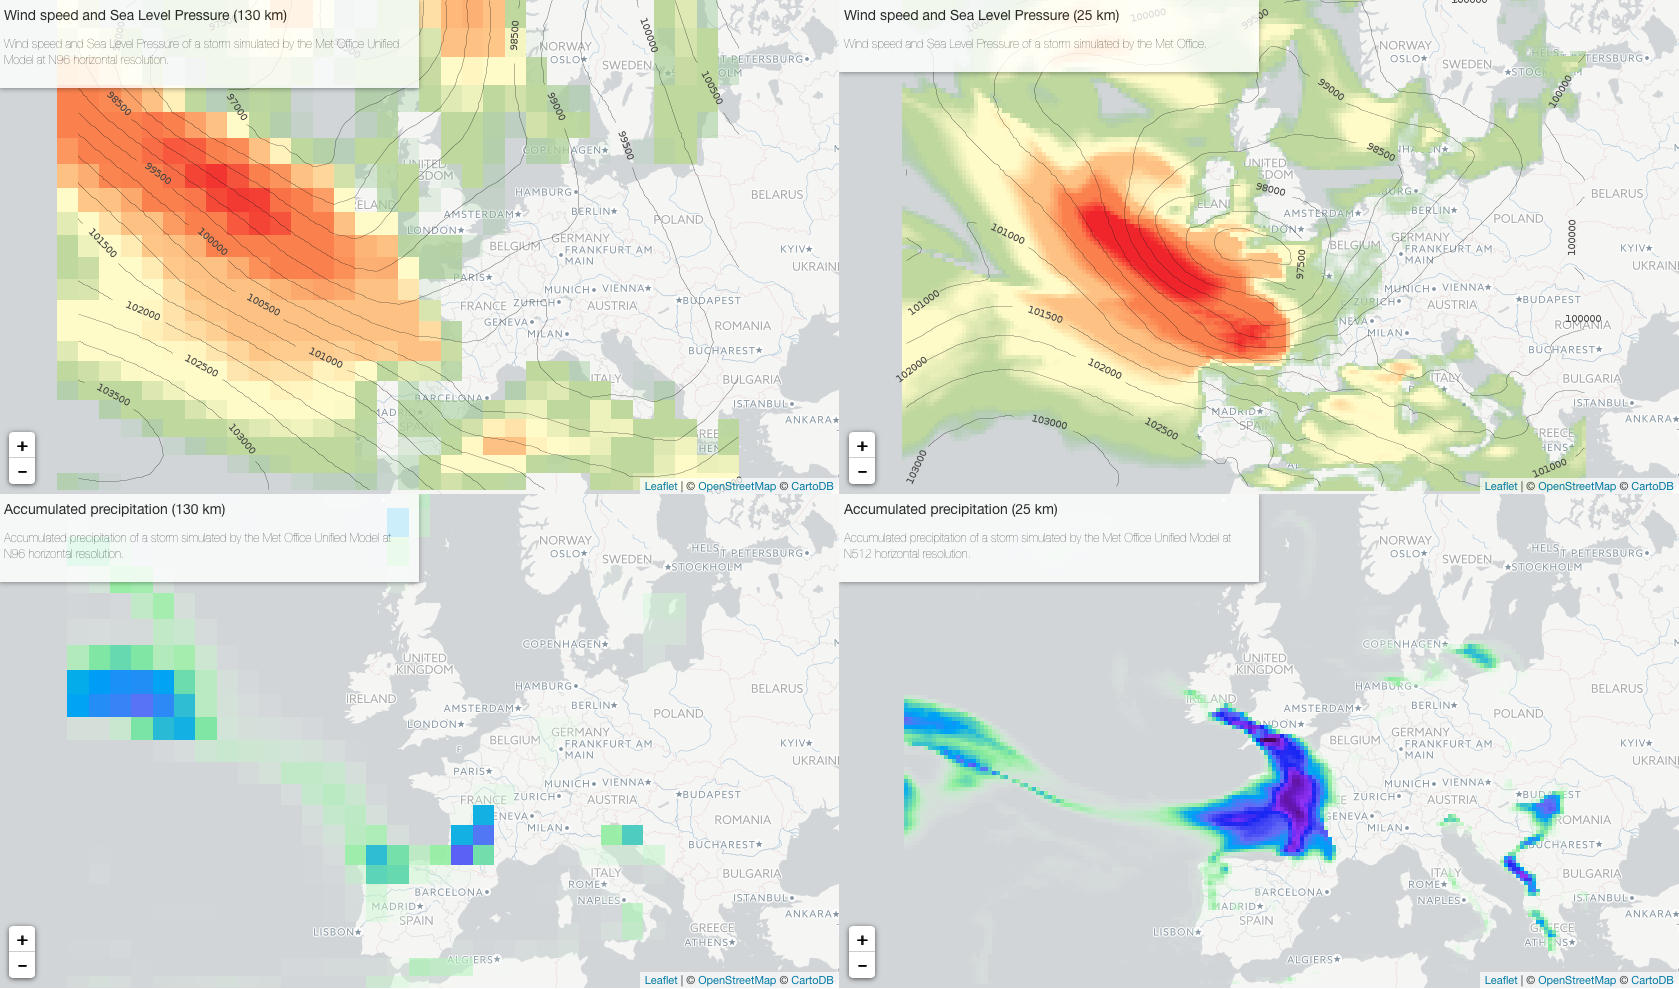
Plot of the month (November 2017) is from the PRIMAVERA project and shows how extratropical storms are represented in a high-resolution, 25 km global climate model.
Following on from previous posts, the figure below shows in detail how winds and precipitation, particularly along the trailing front and the maximum over France, are represented more realistically in a 25 km global model.
Figure | Extratropical storm in a 130 km (left) and 25 km (right) model. (Click for a larger version.)
Find out more here.
