Plot of the month for August 2017 is a collection of animated visualisations of high-resolution global climate model data, created by HRCM scientists and colleagues within the PRIMAVERA project.
Animated visualisation of global climate data - whether model output or observations - brings to life what are often termed the synoptic-scale 'building blocks' of climate. Here are a few new animated visualisations of high-resolution global model output, representing the cutting edge of global climate models. These have been compiled to showcase the models involved in the PRIMAVERA project, which is a current focus of the HRCM group.
Figure | High-resolution atmosphere simulation with the EC-Earth model (courtesy of Francois Massonnet).
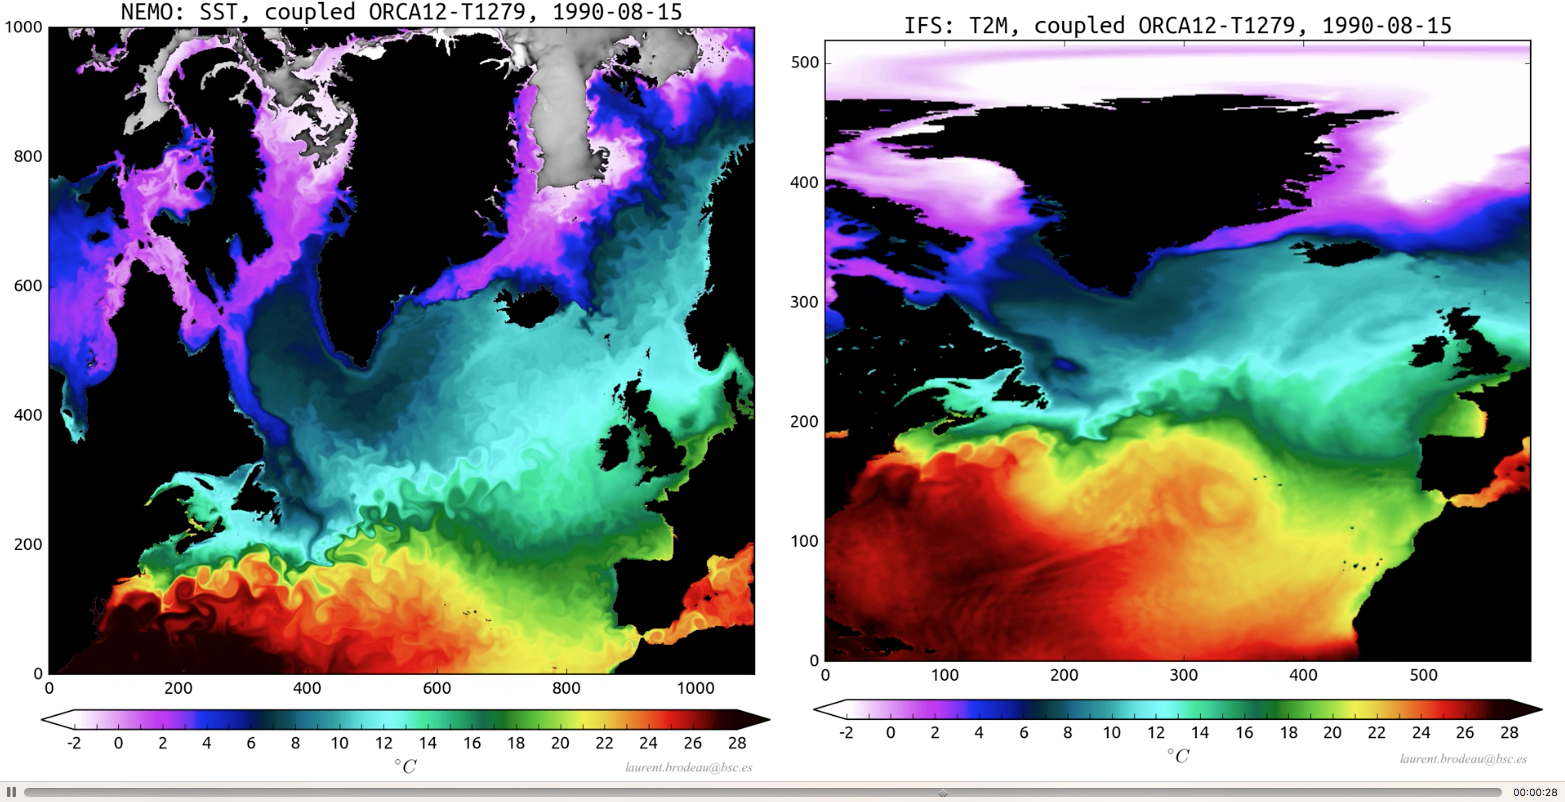
Figure | The coupled atmosphere-ocean GCM version of EC-Earth (i.e., NEMO+LIM3 - OASIS - IFS) at "ground-breaking resolution" of T1279-ORCA12, or ~16 km in both atmosphere and ocean (courtesy of Barcelona Supercomputing Centre). In the North Atlantic region of this simulation, the influence of cold and warm Gulf Stream ocean eddies on the 2-meter air temperature field may be seen. (Watch the video here.)
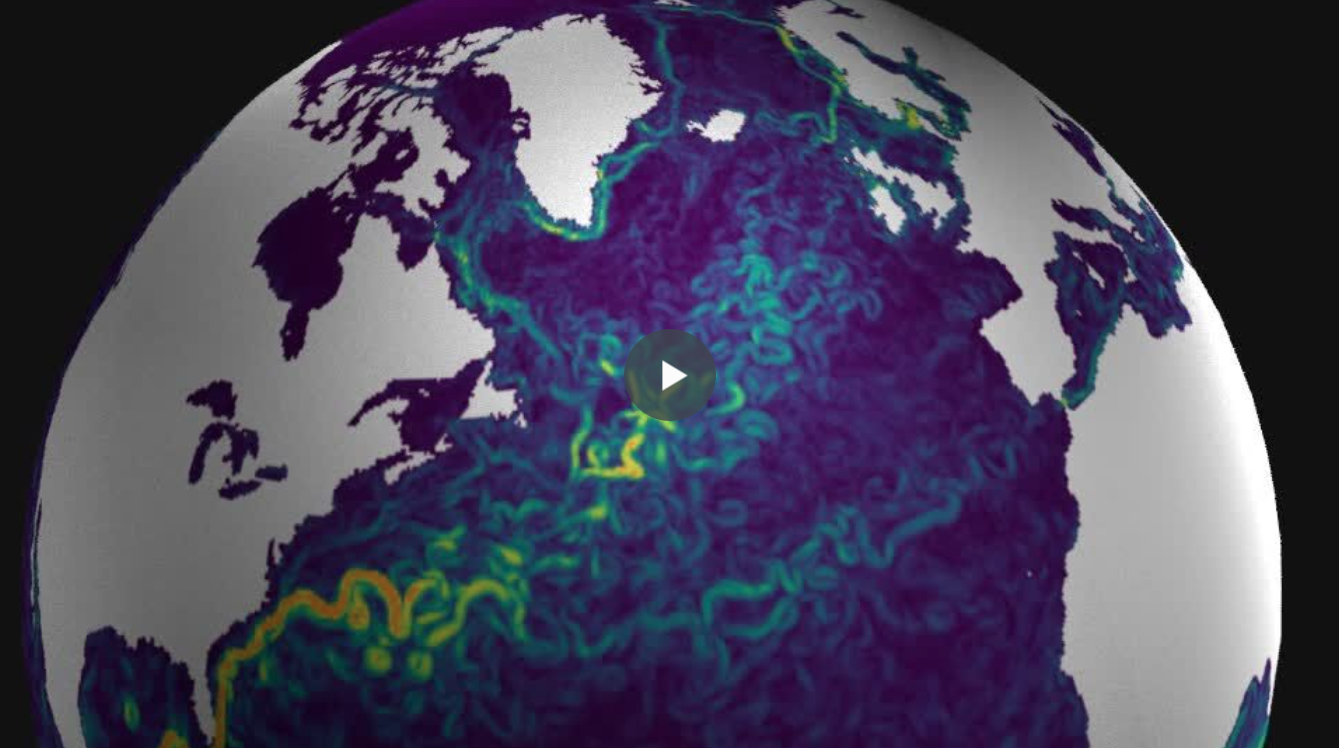
Figure | 30-year spin-up of the Met Office coupled model HadGEM3-GC3.1 at N216-ORCA12 resolution (~60-km atmosphere and 1/12 degree ocean), completed following the HighResMIP protocol (courtesy of Malcolm Roberts). The colours show daily surface ocean current speeds, with flickering features that result from atmospheric storms passing over the ocean. (Watch the video here.)