Plot of the month for July 2017 is from Benoît Vannière, who studies how precipitation simulated by several global climate models changes when the models' atmospheric resolution is increased.
There is great interest within the climate community and beyond in the representation of precipitation and the processes which drive it in global simulations. In particular, systematic changes with atmospheric resolution (i.e., those which are found across multiple models) tell us about the role of resolution and its importance in representing such processes.
The figure represents the difference of annual mean precipitation between high and low resolutions averaged for an ensemble of six global climate models. The six different models of this ensemble (with their low and high resolutions respectively given in parenthesis) are HadGEM3-GA3 (N96 and N512), EC-EARTH3 (T159 and T1279), EC-EARTH3.1 (T255 and T1279), GFDL-HIRAM (C180 and C360), CAM5.1 (2 deg and 0.25 deg) and MRI3.2 (T95 and T959). A small dot is overlaid on pixels where five of the six models agree on the sign of the difference and a large dot where all six models agree.
Despite the differences being small in some regions (note the logarithmic colour scale), models agree on the sign of sensitivity to resolution in several regions. In particular, they show:
- an increase of precipitation over orography, the entrance regions of storm tracks, river basins across South America, and the Sahel region.
- a decrease of precipitation over the Maritime Continent.
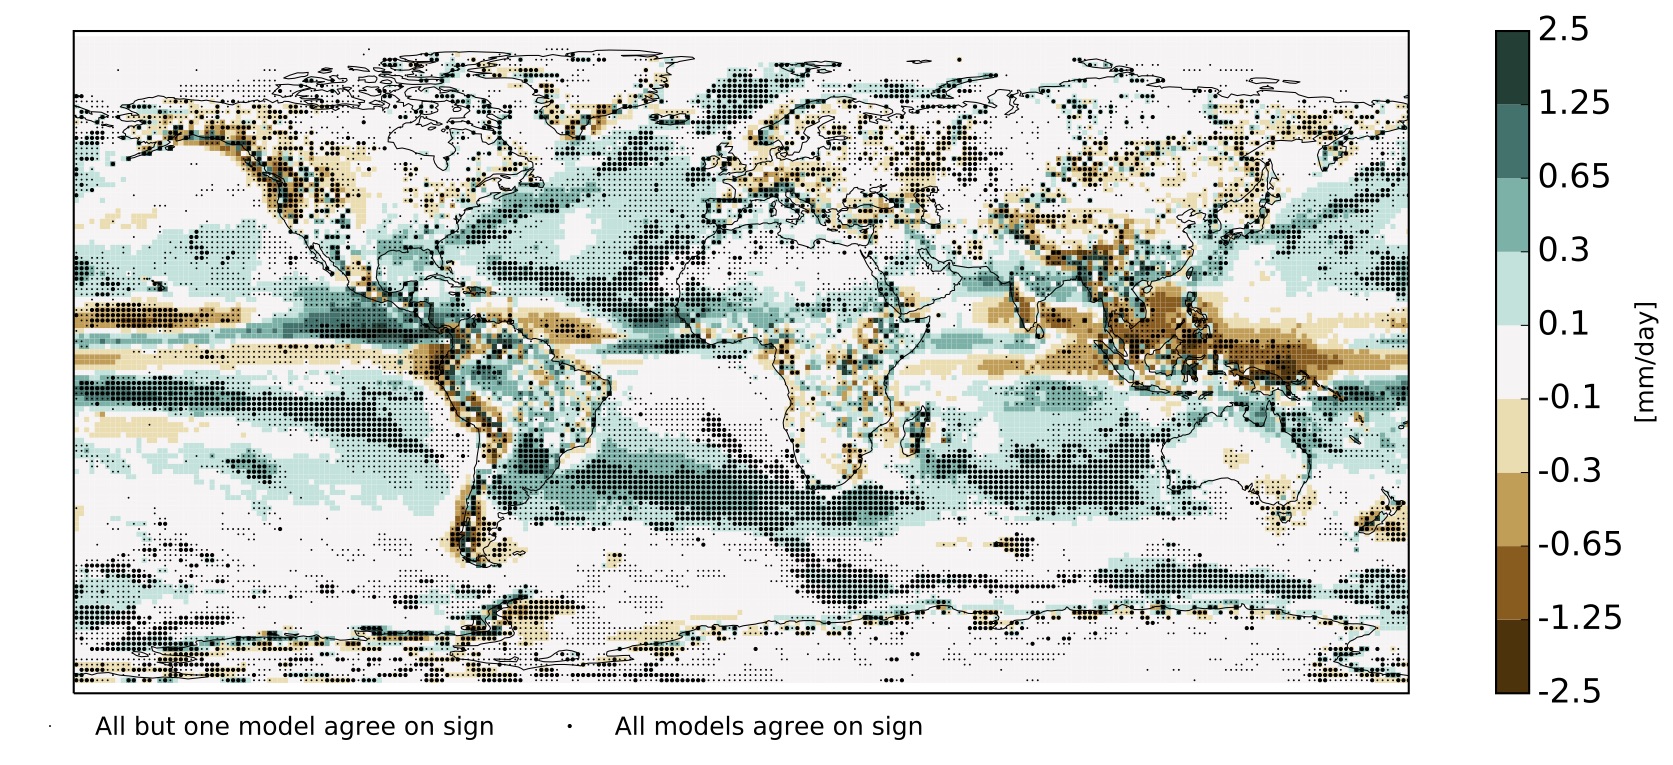
Figure | multi-model mean difference between high- and low-resolution global precipitation. Units are mm per day. A small black dot indicates five out of six models agree on the sign of the precipitation change at that model grid box; a large dot indicates that all six models agree. (Click the image for a larger version.)
This work is currently in preparation for publication.