Plot of the month for June 2017 is from Alexander Baker, who evaluated latitudinal variability in the North Atlantic eddy-driven jet in UPSCALE model simulations.
Europe is affected by cyclonic storms that track in an eastward direction across the North Atlantic basin, which lead to heavy precipitation and high wind conditions, each with considerable socioeconomic impacts. (For more background, see May 2017's plot of the month.)
Following work by Wollings et al. (2010), we computed the zonal mean profile of the winter (December-February) mean zonal wind (over lower atmospheric levels) and identified its maxima, giving us a metric for the eddy-driven jet position. This analysis was performed for the UPSCALE atmosphere-only present-day climate simulations (1985-2011) across three model horizontal resolutions: N96 (130km), N216 (60km) and N512 (25km).
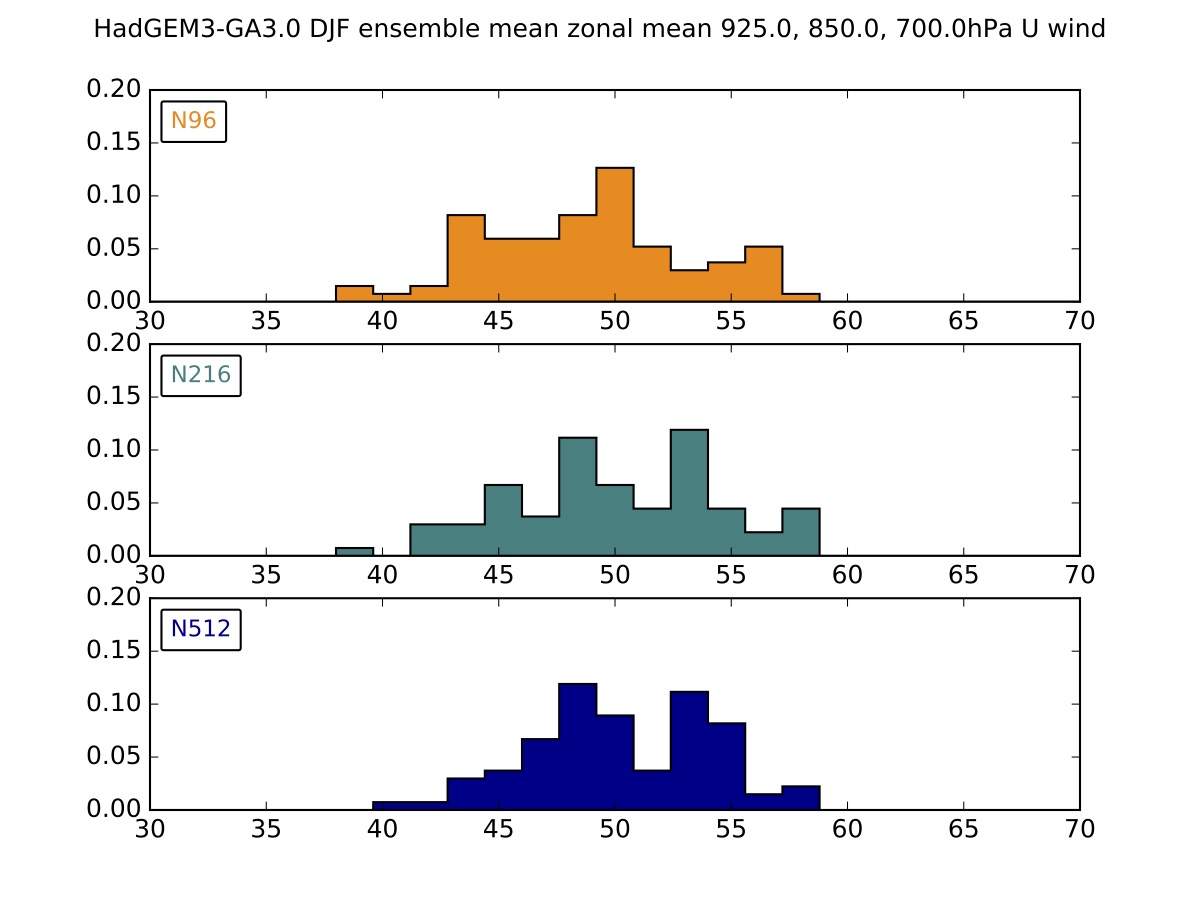
Figure | Eddy-driven jet latitude histograms across model resolutions. (Click the image for a larger version.)
The regime behaviour of the eddy-driven component of the mean winter zonal flow over the North Atlantic basin is better-captured at N512 resolution, with clear separation between northerly and southerly jet regimes. One caveat is that better sampling of sub-seasonal jet variability is also important, which is a current research activity in HRCM.
This is ongoing work.